ASER Security & Monitoring
Coming soon — early access on requestMonitor Your Critical Infrastructure. Detect Problems Earlier.
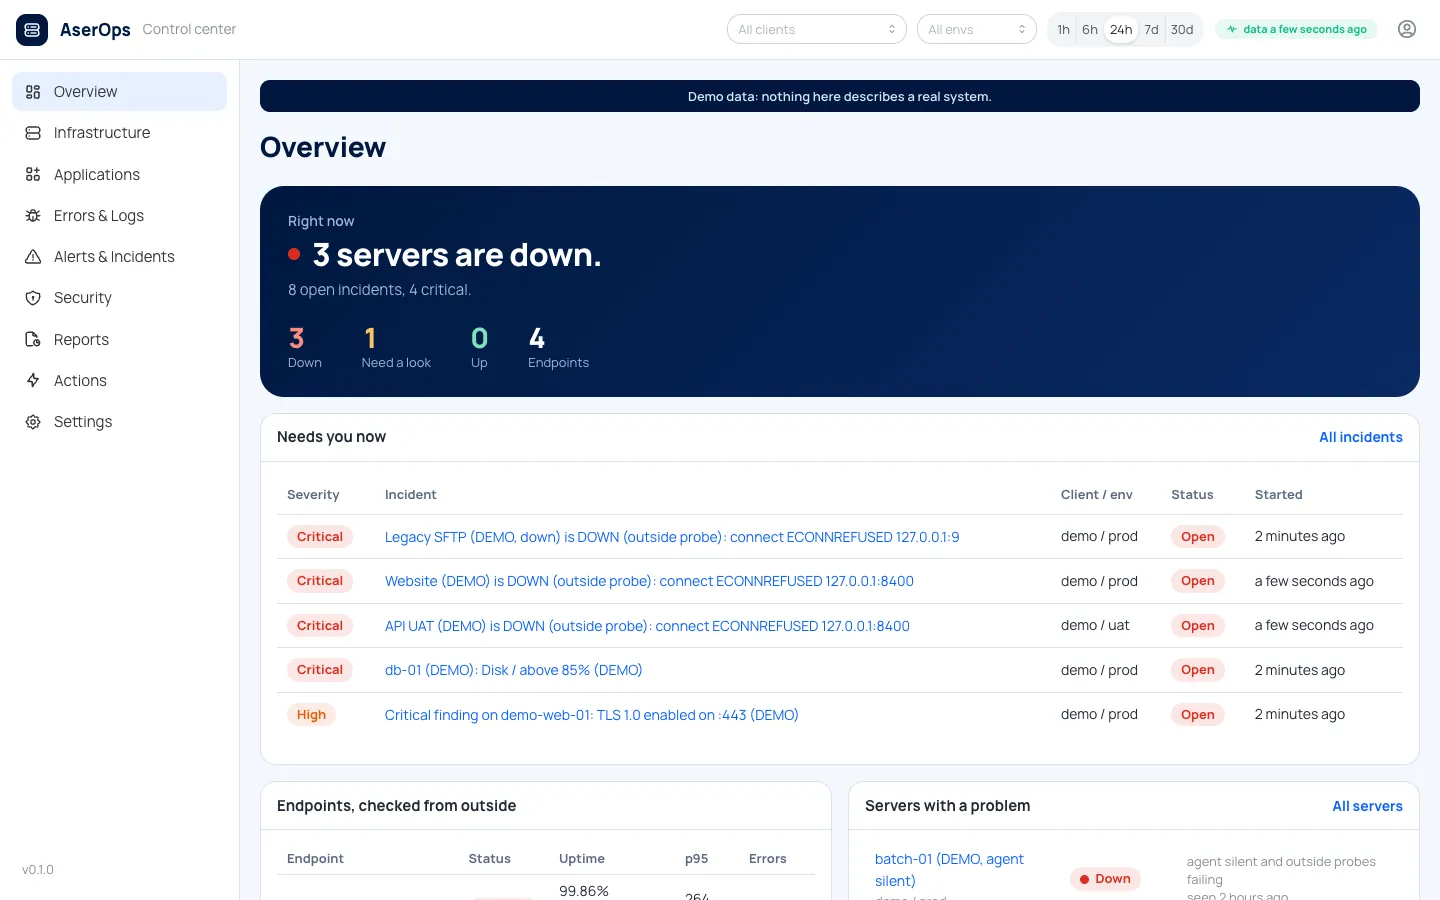
One console for your servers, applications, network services and security findings. Your team sees what needs attention first.
Who it is for
Built for teams that cannot afford blind spots.
- Banks and financial institutions
- Telecom and payment providers
- Organisations with many sites and partner links
- Operators of critical infrastructure
- IT operations teams
What it covers
Infrastructure monitoring and network telemetry, with an honest status.
Each line says where it stands today. Early preview: built, and open to a customer who wants to try it on their own servers. Ask through the contact form.
| Capability | What you get | Status |
|---|---|---|
| Infrastructure dashboard | Hosts, services and open incidents on one screen. | Available |
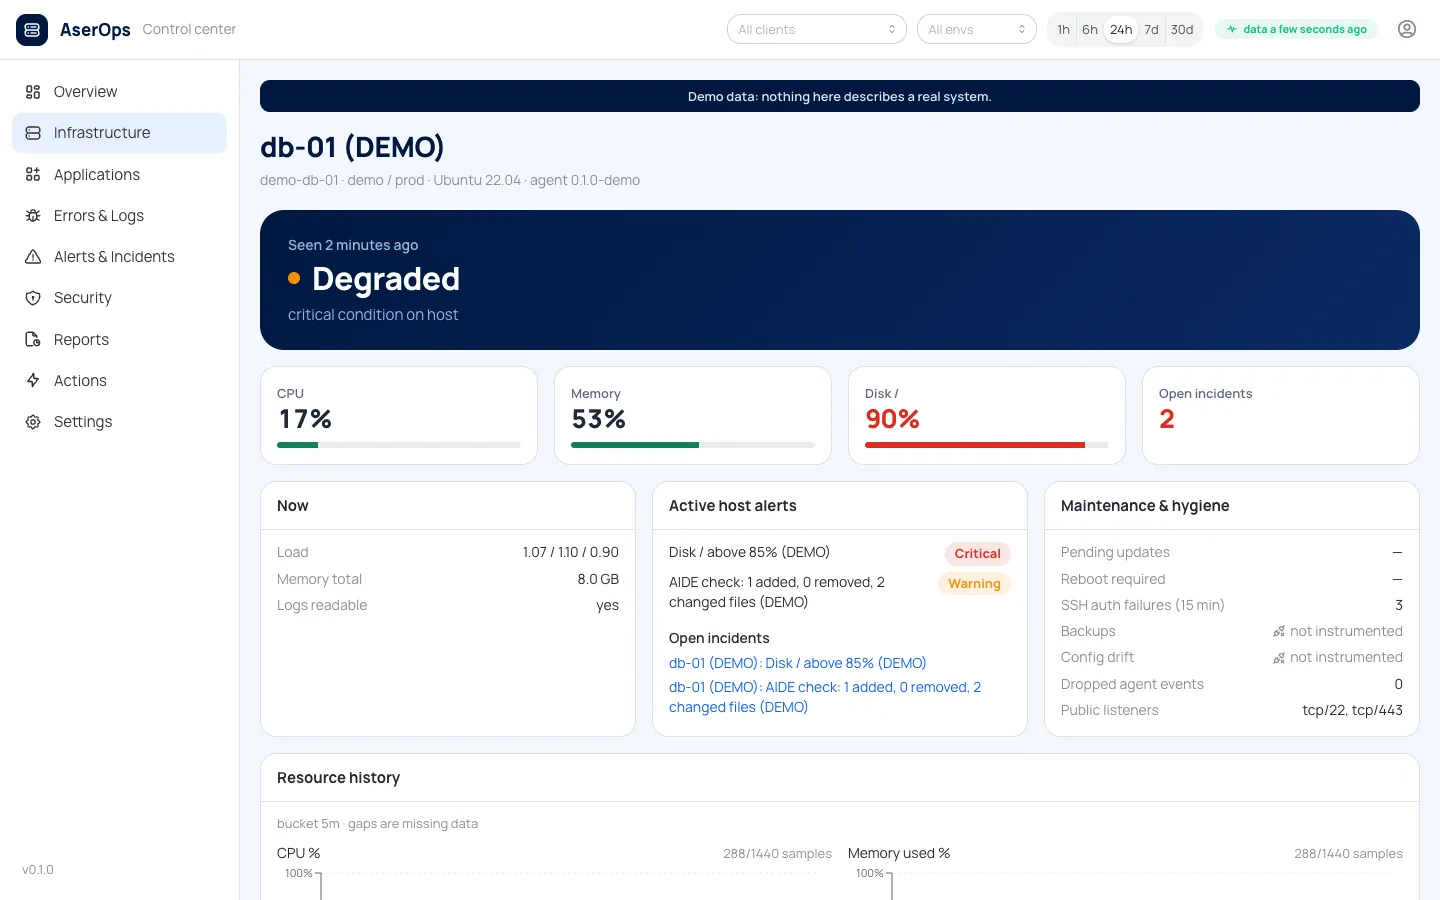
| Server health | CPU, memory, disk, load and failed services on every server. | Available |
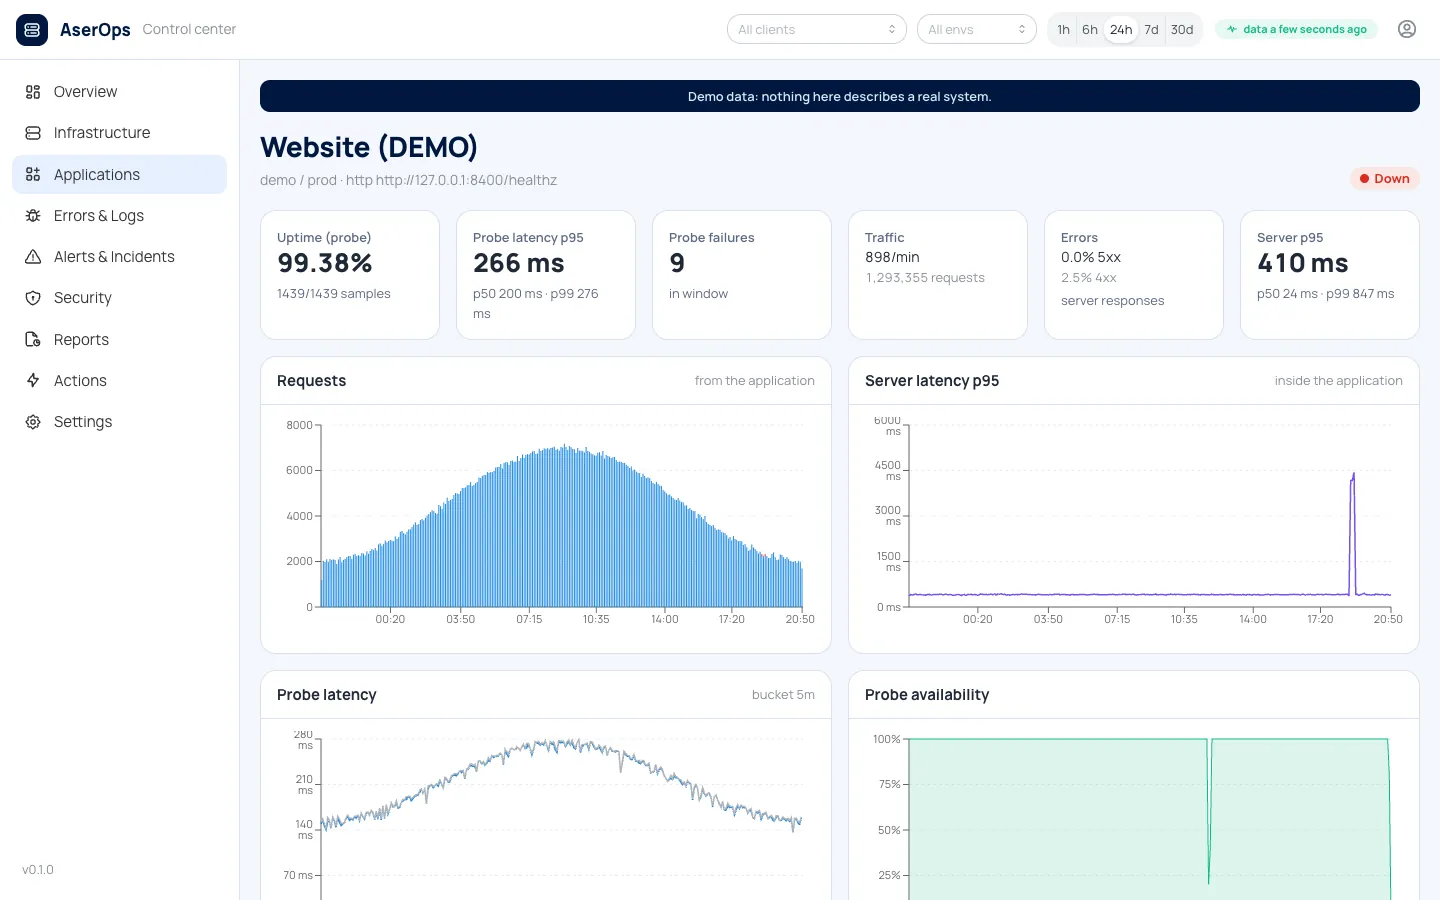
| Availability checks | Websites and services tested from outside: uptime, response time, certificate expiry. | Available |
| Network telemetry | Firewall drops and web traffic per server, plus connection checks to your endpoints. | Available |
| Bandwidth per network interface | Traffic in and out of each network interface, with charts in the console. | Early preview |
| Application performance — Node.js | Requests, slow routes, slow database queries and errors, seen from inside the app. | Available |
| Application performance — Java | The same view for Java applications. | Early preview |
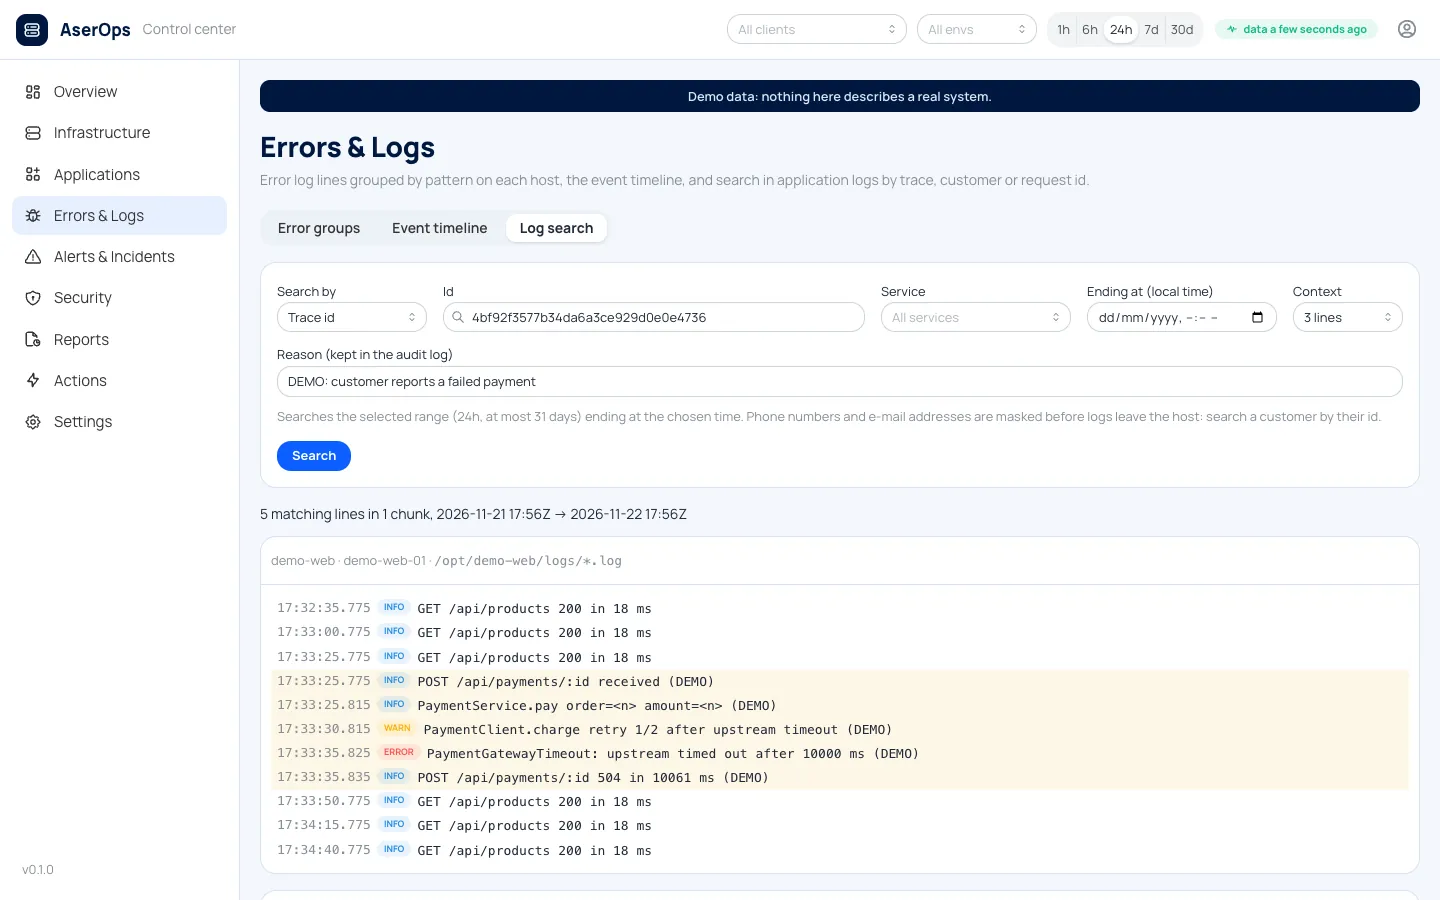
| Error grouping and log search | Errors grouped by pattern. Find a request's log lines by its id; personal data is masked first. | Available |
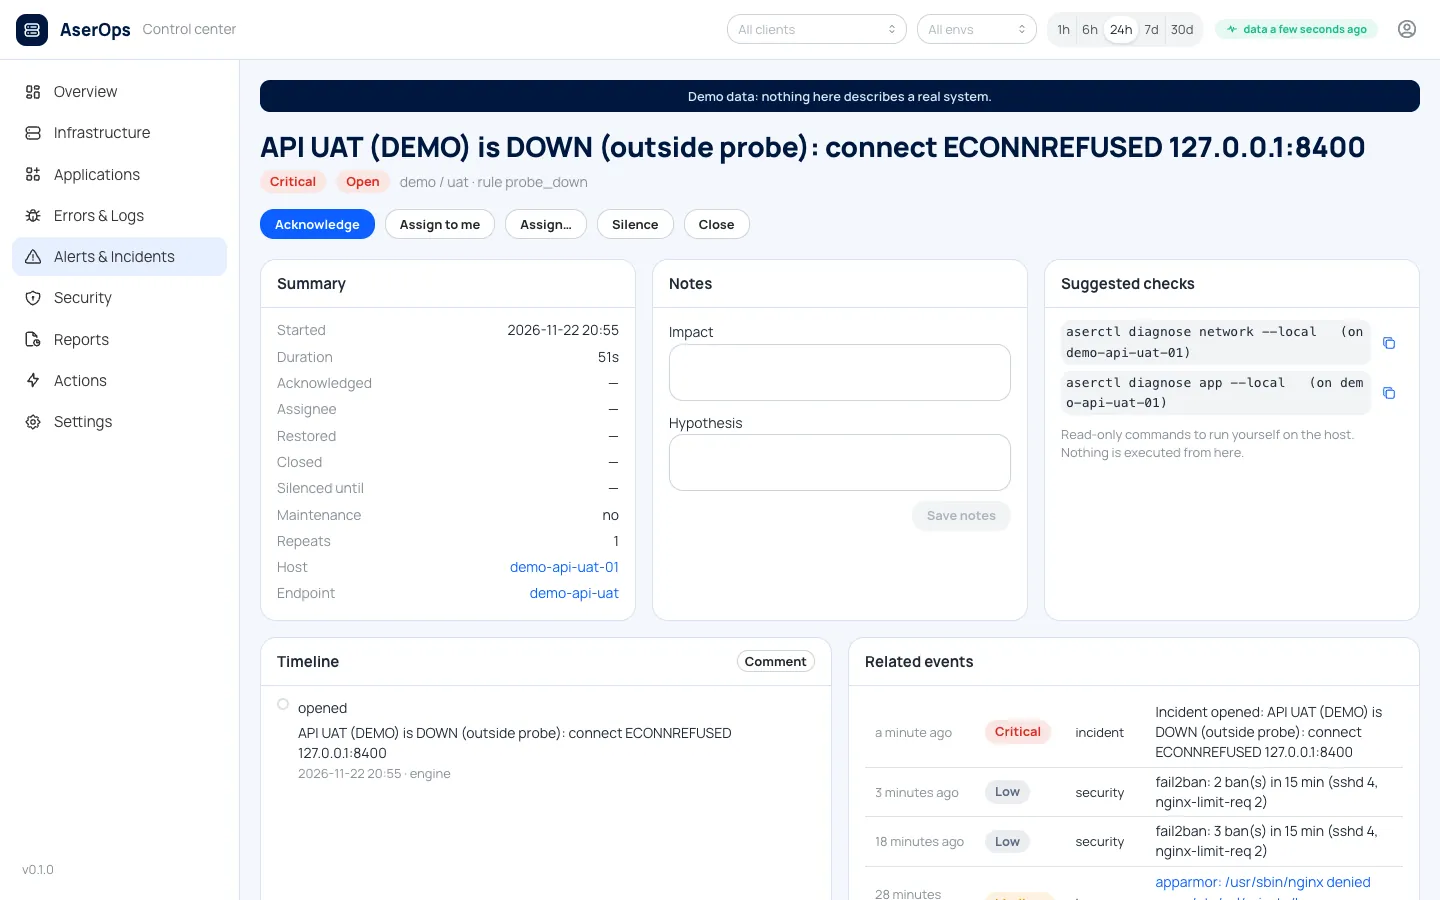
| Alerts and incidents | Severity, acknowledge, assign, silence, notes and a timeline. Chat alerts for critical issues. | Available |
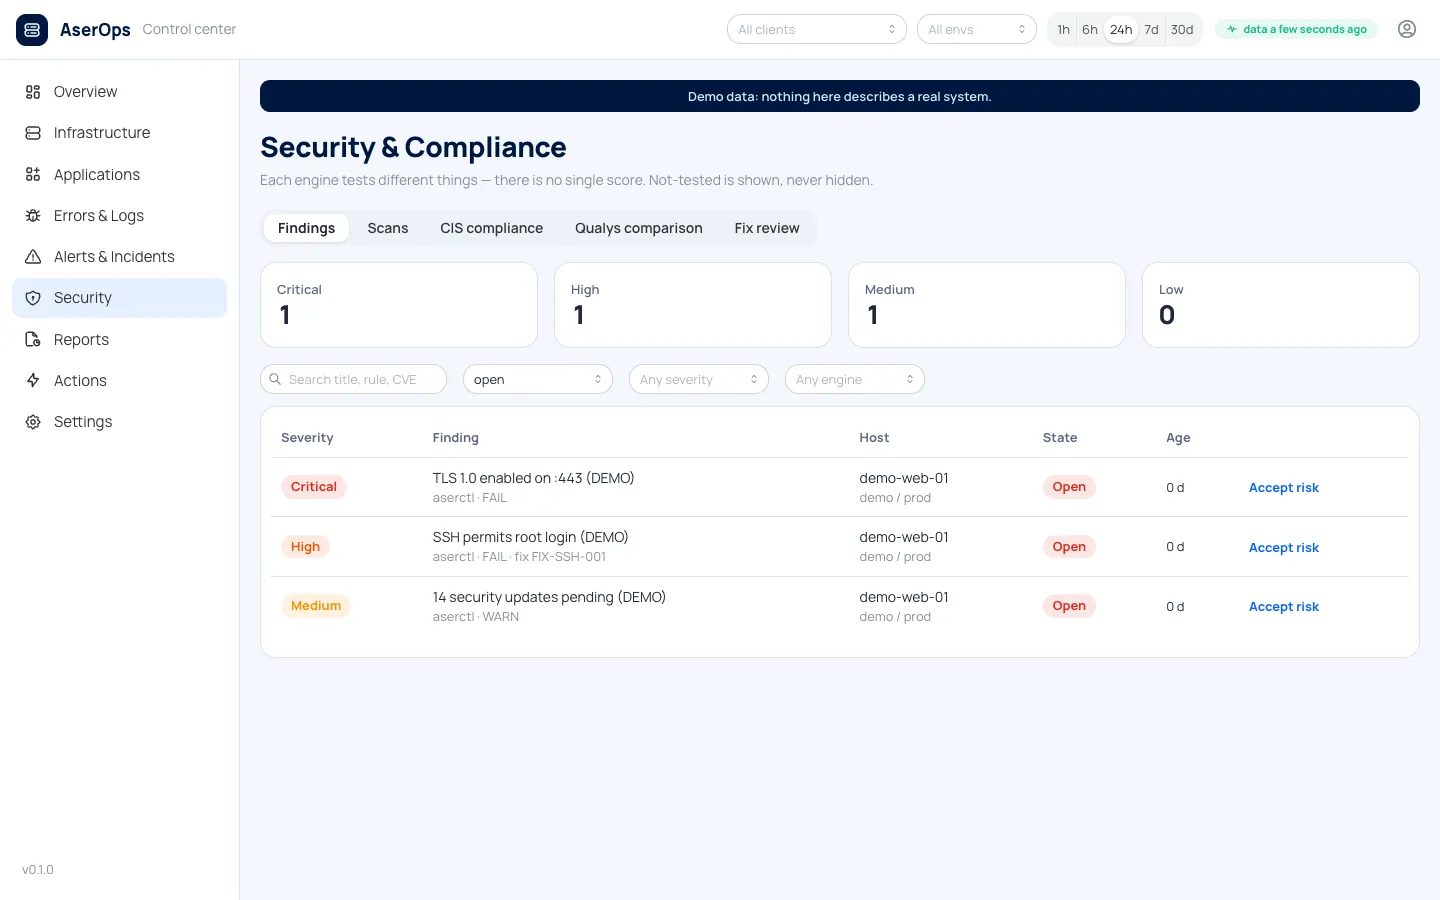
| Security findings | Hardening scans, file-change checks and blocked-login signals, with suggested checks. | Available |
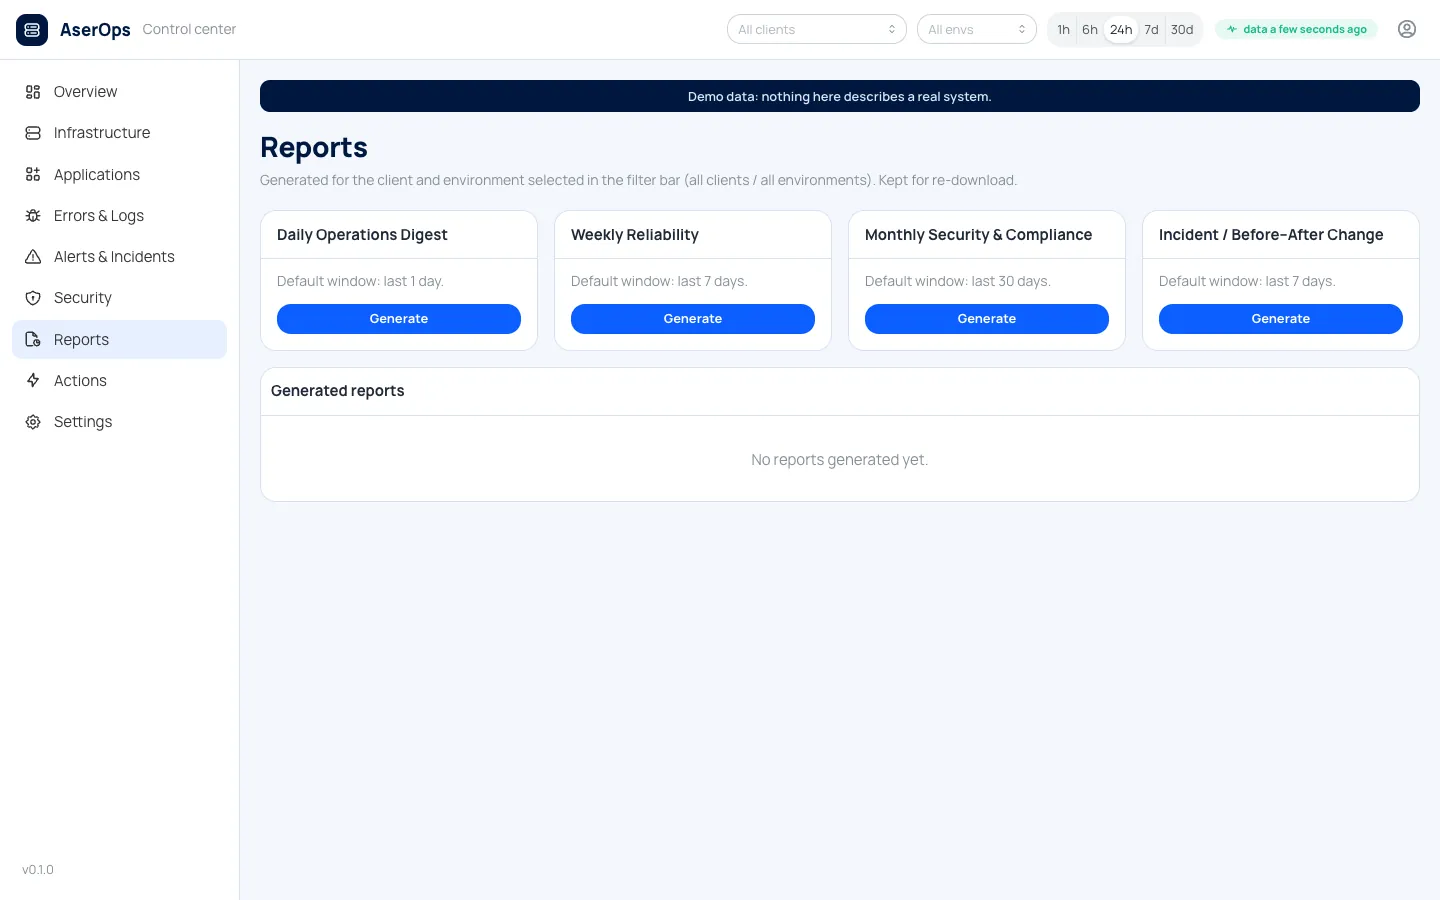
| Availability and security reports | Daily operations, weekly reliability, monthly security, incident before and after. | Available |
| Audit trail | Every change and every log search is recorded: who, when and why. | Available |
| VPN tunnel health and uptime | State and uptime of each partner tunnel. A tunnel that is up but passes no traffic is flagged. | Early preview |
| SMS gateway and operator links | Gateway status, each operator's SMS link and its queue, with an alert when a link drops. | Early preview |
| Fixed actions from the phone | Restart a service, free disk space, read a log or reboot, from a list set on each server. Signed on a registered phone; risky ones need a second engineer. | Early preview |
In the console
Real screens, demo data.
How early access works
Small start, on your own servers.
- 1
Scope
We agree which servers and services to watch, and who receives alerts.
- 2
Install
A small agent goes on each server. It sends data out and opens no port.
- 3
Watch
We add outside checks for your endpoints. Your team uses the console from day one.
- 4
Review
We go through the reliability report together and agree the next step.
By default the console only observes. Phone actions stay off until you switch them on for a server, and nobody can type a command.
Monitoring shows problems sooner. It does not replace your security controls or guarantee uptime.
Want to try it early?
Contact us for an early trial on your own servers.